D3 on Angular: Reusable Components
Components become more important these days. In the future you will get to hear more and more about Web Components, which get available in Angular 2.0 as well, to create different reusable components. While you already weave multiple angular directives into each other, there are only a few articles which describe this reusability with d3 directives. The article shows how you can achieve reusable components with D3 on Angular.
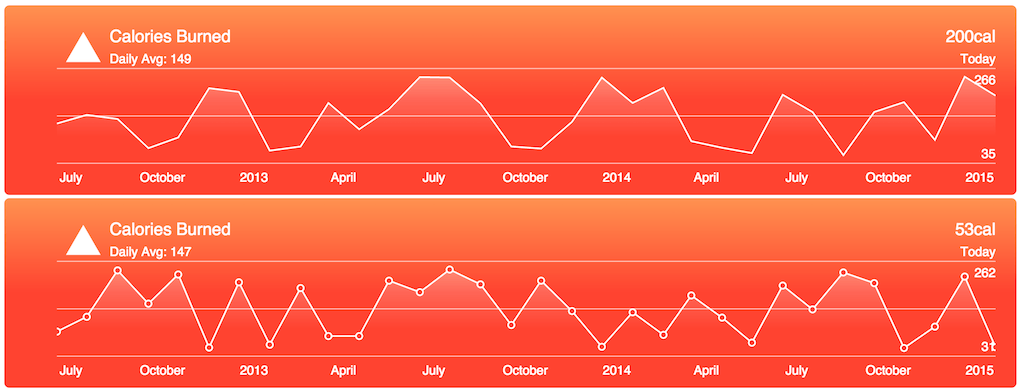
As you can see on the picture, there are two line charts which look nearly similar, but one chart has some circles to indicate the data points. When building D3 visualizations with Angular directives, it often happens that the D3 directive gets 1000 lines of code or even more. Composing components has different advantages: It allows you to separate one big component in smaller components. Moreover you can decide whether you want a certain component for your main component (in this case without or with circles). Imagine what possibilities you can achieve with multiple components. A composition of directives in HTML can be easily achieved:
<line-chart data="dataOne"></line-chart>
<line-chart data="dataTwo" scatter></line-chart>
While one line chart has circles, the other one hasn’t. One could assume that this is done in one directive, which just has to look if there is a scatter attribute. But no, scatter is an own directive, which communicates via its parents controller with the line chart directive. Moreover the scatter directive updates when the line chart directive gets updated. This is handled by an event, but it would be nice to hear suggestions about other solutions.
The whole example + source code can be found here:
The main code snippets can be found in the lineChart and scatter directives.
Scatter:
function Scatter() {
  return {
  restrict: 'A',
  require: '^lineChart',
  link: function (scope, element, attrs, ctrl) {

    var x, y, scatterElement, data;

    init();
    display();

    scope.$on('LineChart:update', update);

    function init() {
      scatterElement = ctrl.getScatterElement();
      x = ctrl.getX();
      y = ctrl.getY();
    }

    function display() {
      scatterElement.append("g")
        .attr("class", "scatter")
        .selectAll("circle")
        .data(scope.data)
        .enter().append("circle")
        .attr("class", "dot")
        .attr("cx", function(d) { return x(d.date); })
        .attr("cy", function(d) { return y(d.rate); })
        .attr("r", 3);
      }

    function update() {
      init();

      scatterElement.selectAll(".dot")
        .transition().duration(500)
        .attr("cx", function(d) { return x(d.date); })
        .attr("cy", function(d) { return y(d.rate); });
    }

  }
  };
}
Relevant code snippte of Line Chart:
...

this.getScatterElement = getScatterElement;
this.getX = getX;
this.getY = getY;

function getScatterElement() {
  return svg;
}

function getX() {
  return x;
}

function getY() {
  return y;
}

...

function onBrushSetHandler($event, data) {
  display(data);
  $scope.$parent.$broadcast('LineChart:update');
}